
Trends in Share Price & Dividends
As of April 1st, 2024, Fujitsu conducted a stock split at a ratio of 10 shares per common share. Figures show amounts converted to the post-stock split basis.
Highest and Lowest Share Price (Yen)
| FY 2018 | FY 2019 | FY 2020 | FY 2021 | FY 2022 | |
|---|---|---|---|---|---|
| Highest | 826.5 | 1,295.0 | 1,725.0 | 2,209.5 | 2,067.0 |
| Lowest | 633.0 | 710.1 | 919.5 | 1,461.5 | 1,532.0 |

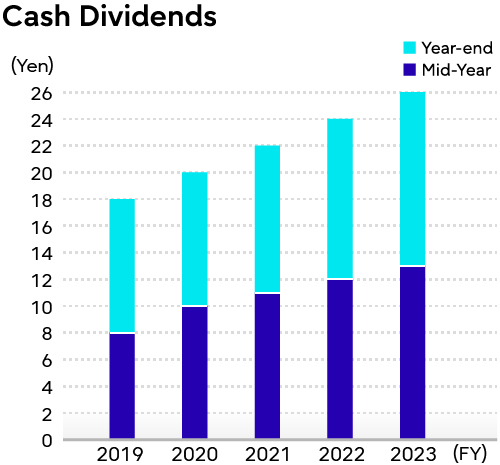
Cash Dividends (Yen)
| FY 2018 | FY 2019 | FY 2020 | FY 2021 | FY 2022 | |
|---|---|---|---|---|---|
| Full year | 15 | 18 | 20 | 22 | 24 |
| Mid-year | 7 | 8 | 10 | 11 | 12 |
| Year-end | 8 | 10 | 10 | 11 | 12 |