
Technique for Explaining Causes of Congestion Using Pedestrian Simulation
Release date: May 27, 2020
Congestion at facilities such as airports, shopping centers, and event venues occurs at choke points and popular stores where people congregate. Pedestrian simulation has attracted attention in recent years as a way to predict congestion and to visualize the effectiveness of congestion mitigation measures. While simulation is typically used to predict the future or visualize possibilities, a close analysis of the calculation process involved can also uncover the reasons why a phenomenon is caused. This is also the case with pedestrian simulation, only with the additional difficulty that identifying the causes of congestion takes a lot of effort by a person with specific expertise. To overcome this problem, Fujitsu Laboratories has developed a technique that uses micro-dynamics analysis to automatically analyze pedestrian simulation logs. When applied to the pedestrian simulation of an airport, the technique was able to identify the causes that made reasonable sense. Moreover, eliminating the causes succeeded in reducing congestion. This paper describes pedestrian simulation and the micro-dynamics analysis technique and presents the results of an evaluation experiment.
- 1. Introduction
- 2. Pedestrian simulation
- 3. Micro-dynamics analysis technique
- 4. Evaluation experiment
- 5. Conclusion
1. Introduction
Congestion at airports, shopping centers, event venues, and other facilities where a lot of people wander for diverse reasons occurs at choke points or popular stores where people congregate. As well as making facilities less safe, congestion also reduces levels of user satisfaction. In order to overcome this problem, facility managers have attempted measures, like making layout changes or installing new informational signage, by trial and error. Unfortunately, estimating the effect of the measures has proved difficult due to human factors such as people’s tendency to avoid crowds. The factors create new congestion at unexpected locations or cause unpredictable changes in people behavior.
Recent years have seen rising interest in ways of using the simulation of pedestrians to predict how people flow about within a facility and to visualize how measures will affect levels of congestion. Simulation imitating individual pedestrians’ behavior is known as “pedestrian simulation.” Pedestrian simulation provides a way to predict when and where congestion will occur and assess measures, while it does not explain why congestion occurs. More precisely, it is possible to find out what sort of people will get caught up in a crowd and what triggers it by tracking the events on the simulation in time order. Such an analysis, however, takes a lot of effort and requires specialist expertise.
To overcome this problem, Fujitsu Laboratories has developed a new technique that uses micro-dynamics analysis to automatically analyze pedestrian simulation logs. As simulation reproduces congestion by using thousands or tens of thousands of artificial “agents” replicating individuals, the new technique makes the analysis of agents easier by summarizing the varieties of characteristics of the huge number of agents, such as the destination, route, and perceived information. This technique can be used to investigate the causes of congestion at a particular location by identifying the attributes of those people who make up the crowd, what information they have perceived, and how they act. Other potential uses include recommending the best measures to take with accompanying reasons, and helping facility managers to come up with new measures for reducing congestion.
This paper describes the pedestrian simulation developed by Fujitsu Laboratories, the newly developed micro-dynamics analysis technique, and the results of an experiment to evaluate the technique.
2. Pedestrian simulation
Past attempts at reducing congestion at facilities where people congregate have involved both direct and indirect measures for controlling pedestrian flow. Direct control measures have included restricting entry numbers, upgrading the capacity of facilities that provide services, and making changes to the site layout. An example of an indirect control measure, on the other hand, is the provision of signage to indicate the level of congestion. Another, used at places such as restaurants, is to issue coupons redeemable at off-peak times. While indirect control has attracted interest in recent times for its advantages of being inexpensive to implement and unlikely to detract from user satisfaction, a problem with the approaches is that their effects can be difficult to estimate.
Having recognized the importance of indirect measures for congestion mitigation, such as providing information about the extent of congestion or offering coupons and other incentives, Fujitsu Laboratories went on to develop a pedestrian simulation that is able to evaluate both direct and indirect control measures. Specifically, this involved developing agent models that replicate the visitor choice behaviors that determine how visitors to a site move about, for example, destination choice based on their preferences as well as on how far away and how crowded the location is, and information perception and information processing of how the choice changes in response to their acquisition of information at the site. By using artificial agents implemented with these models, the simulation is also able to evaluate indirect control measures. Fujitsu Laboratories and Fujitsu have been jointly developing techniques for enabling the precise simulation of people’s movements, with 25 patents currently pending in Japan and overseas, including for the agent models that make it possible to evaluate indirect control measures.
3. Micro-dynamics analysis technique
Pedestrian simulation comprises thousands or tens of thousands of agents, each of which possesses a range of attributes that include age, gender, and reasons for being at the location. The simulation can replicate many different forms of congestion by using agents who move in accordance with their choice of where to go and who change their choice based on information about routes and congestion levels obtained from signage and other sources. Thus, if you want, you can understand congestion, which is a collective action, from the level of each agent. Focusing on this point, a technique of explaining a macro phenomenon, such as congestion, from its micro causes, such as the attributes and past actions of agents, is called micro-dynamics analysis [1].
The conventional approach to micro-dynamics analysis has been to start by identifying the agents involved in congestion. Then, these agents are characterized in terms of several dozen or more parameters that represent their attributes, actions, and cognition, such as having a purpose to go to a restaurant, having viewed an informational display at a particular location, or having eaten a meal at a restaurant. Finally, experts would then review these characteristics to interpret the causes of congestion. Since this approach involves the expert having to integrate a large number of characteristics, it has problems that include being very time consuming and the risk of causes going overlooked.
To overcome these problems, Fujitsu Laboratories has developed a new micro-dynamics analysis technique for automatically analyzing simulation logs. The technique first groups several dozen or more parameters into attributes, actions, and cognition, then clusters the agents according to the grouped parameters [2]. By using the clusters each agent belongs to as characteristics, it is possible to represent each agent with a small quantity of information, in other words to represent each one by its summary characteristics (Figure 1).Next, the degree of similarity between the set of agents involved in congestion and the sets of agents who possess each combination of summary characteristics are evaluated using the F-value, making it possible to identify all of the characteristics of the agents involved in congestion without any omissions. This enables all of the micro causes of the congestion at a particular location, namely what attributes the agents involved in congestion have, what information they have acquired, and what they have been doing, to be identified. These micro causes can be used to assess the validity of the prediction from the viewpoint of on-site knowledge, thereby boosting confidence in the simulation.
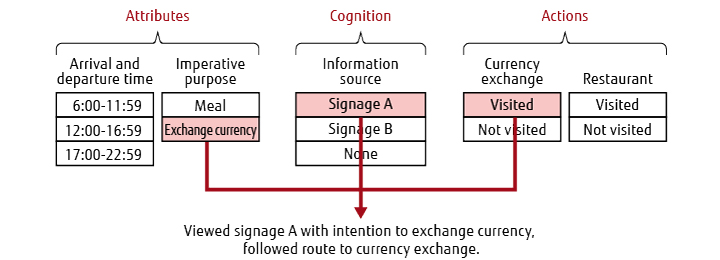
Figure 1 Summarizing of agent characteristics in terms of attributes, cognition, and actions.
Figure 2 shows an example of the new technique being used to analyze the congestion that occurred at two particular retailers at a site (retailers A and B in the figure). A high level of visitors’ awareness of information signage guiding them to retailer A indicated that the signage was the cause of congestion at this location. On the other hand, the congestion at retailer B was found to be caused by a lot of visitors arriving at the same time. It was concluded from these results that crowding at retailer A could be dispersed more widely by replacing the signage and directing visitors to the ATM machine that is the other purpose of visitors, and that thereby it is possible to reduce congestion. Similarly, it was concluded that congestion at retailer B could be reduced by adding staff to handle operations more speedily. In this way, the new technique is able to identify the micro causes of congestion. Moreover, it helps come up with new measures for dealing with congestion.
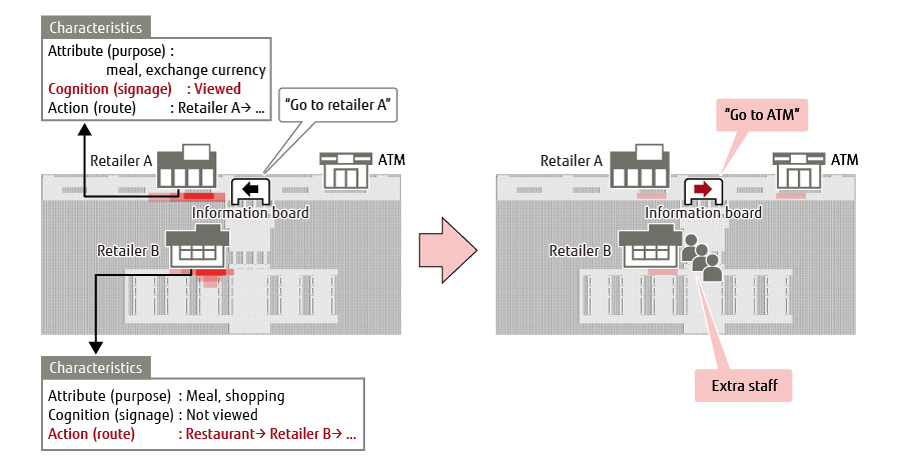
Figure 2 Example use of new technique to identify micro causes of congestion and measures for dealing with it.
4. Evaluation experiment
The new micro-dynamics analysis technique was applied to a pedestrian simulation at an airport to verify its effectiveness. In the evaluation experiment, firstly, the micro causes of congestion were identified by applying the technique to a simulation log. Next, after these causes had been eliminated, the level of congestion was evaluated.
Table 1 lists the results of the analysis. The aim of the analysis was to reveal the causes of congestion that occurred near a restaurant after it opened (from 9 a.m. to 10 a.m.). The degree of similarity between the set of agents involved in the congestion and the set of agents having each combination of characteristics was evaluated using the F-value. The higher the F-value for the characteristics, the better the characteristics represent the set of agents involved in the congestion. The parameters were grouped into attributes, actions, and cognition, then the agents were clustered according to the grouped parameters. The table includes columns: “Arrival and departure time” showing the time agents arrive at and depart from the airport, “Imperative purpose” meaning activities agents must do, “Purpose list” meaning activities agents want to do but are not absolutely necessary, “Places visited” showing places agents visited in time sequence, “Areas passed through” showing areas agents passed through, and “Information obtained” showing signage or other sources agents got information from. “Precision” indicates the proportion of agents involved in the congestion contained in the row, among all agents included in the row (namely, agents having a set of characteristics corresponding to the row). “Recall” indicates the proportion of agents involved in the congestion contained in the row, among all agents involved in the congestion. “F-value” is a statistic that combines Precision and Recall.
Table 1 Characteristics of agents involved in congestion.
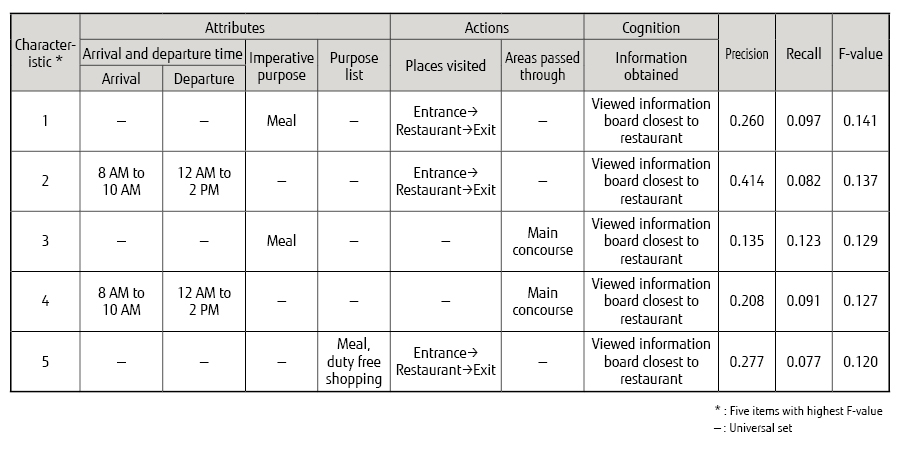
The following explanation uses as an example the most important micro cause (i.e. the row with the highest F-value). Characteristic 1 denotes agents for whom a meal is an imperative purpose, for whom the visit sequence goes from entrance to restaurant to exit, and who viewed the information board closest to the restaurant (where the restaurant location was given). In other words, this indicated that the people involved in the congestion are those who have a purpose of eating a meal, who go directly from the entrance to the restaurant, who view the information board closest to the restaurant and enter the restaurant following it. These results can be used to suggest, for example, that showing a location other than the restaurant on the information board closest to the restaurant could be a good way to reducing congestion. This is because changing the information board should prompt some of the people who would otherwise have gone straight to the restaurant to instead go somewhere else, so it can be anticipated that this will reduce congestion by dispersing the people more widely.
Figure 3 shows the congestion mitigation that results when the agents identified as the most important micro cause are excluded. The horizontal axis is the time of day and the vertical axis is the number of agents waiting at the restaurant. The red band indicates the time period covered by the analysis. The blue baseline represents the number of agents waiting at the restaurant when nothing is done to reduce congestion while the grey line represents the number after the agents identified by this technique as the micro cause have been excluded. In this experiment, 72 agents were excluded out of a total of 2,000. The results indicate that congestion can be reduced by excluding the agents identified as the most important micro cause.
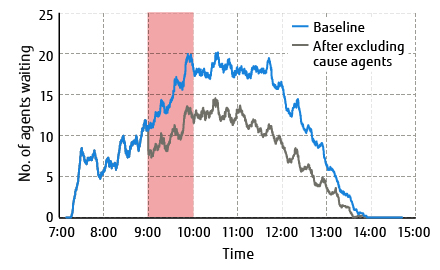
Figure 3 Congestion mitigation by excluding agents identified as a micro cause.
5. Conclusion
This paper described how pedestrian simulation and micro-dynamics analysis can be used to identify the micro causes of congestion. As micro causes can be used to assess the validity of the predictions from the viewpoint of on-site knowledge, they boost confidence in the simulation. It is also possible to use micro causes as a basis for coming up with new ways of reducing congestion. Past practice with simulation has been to use it to predict when and where congestion will occur and to visualize possible scenarios as to whether adopting measures will help reduce it. Our work has added new value to these by developing a micro-dynamics analysis technique using clustering that can identify the causes of congestion. We expect that new value in the form of explanations and discoveries can be generated by combining simulation with machine learning techniques such as clustering.
All company and product names mentioned herein are trademarks or registered trademarks of their respective owners.
References and Notes
- Clustering is a technique for summarizing a large number of elements into small clusters by grouping together those elements that are close to one another, with distance being defined by the similarity between elements. If element characteristics are treated as an n-dimensional vector, then this distance is the Euclidean distance between them. In the case of time-series characteristics, the distance obtained by the dynamic time warping algorithm is used. The grouping of element in turn is done by non-hierarchical clustering (such as k-means) or hierarchical clustering (such as the Ward method). In the case of the technique described here, different distance definitions and clustering methods were used depending on the type of characteristic.Back to Body
About the Authors

Mr. Yamada is currently engaged in research into societal simulation and social system design.

Mr. Yamane is currently engaged in research into AI and societal simulation.

Mr. Ohori is currently engaged in research into social system design using AI and numerical techniques.