
Per Share Data and Financial Position
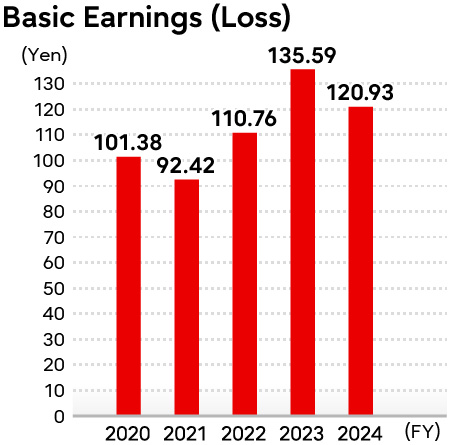
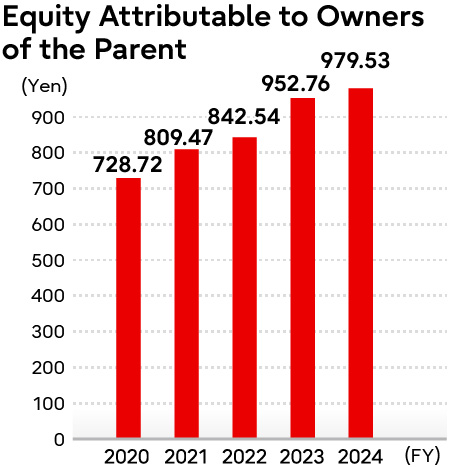
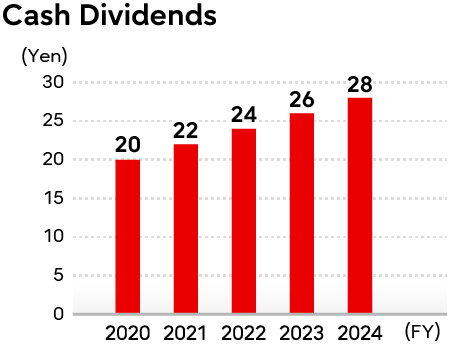
Per Share Data
As of April 1st, 2024, Fujitsu conducted a stock split at a ratio of 10 shares for 1 share of common stock. The following figures have been converted on a post-stock split basis.
 Per Share Data (Updated 20 June 2025)
Financial Position
- Financial Highlights (Updated 20 June 2025)
Accounting terms are all IFRS-based. Corresponding terms in J-GAAP are as follows:
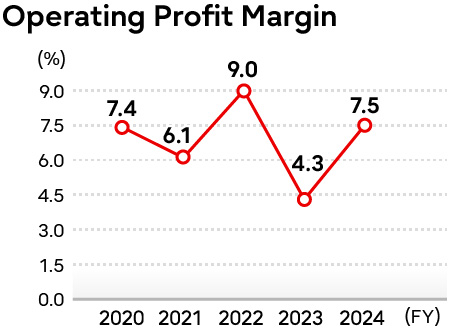
-Operating income Margin / Operating Profit Margin
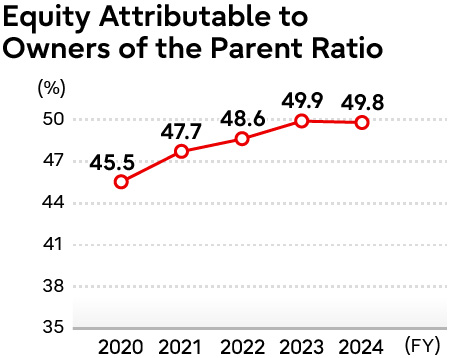
-Shareholders' Equity Ratio / Equity Attributable to Owners of the Parent Ratio
| FY 2020 | FY 2021 | FY 2022 | FY 2023 | FY 2024 | |
|---|---|---|---|---|---|
| Operating Profit Margin | 7.4% | 6.1% | 9.0% | 4.3% | 7.5% |
| Equity Attributable to Owners of the Parent Ratio | 45.5% | 47.7% | 48.6% | 49.9% | 49.8% |
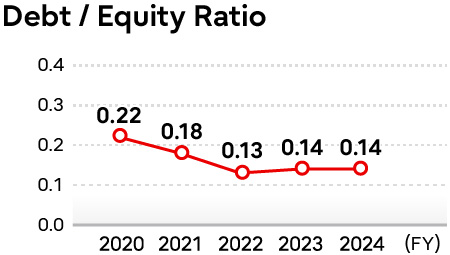
| Debt / Equity Ratio | 0.22 | 0.18 | 0.13 | 0.14 | 0.14 |
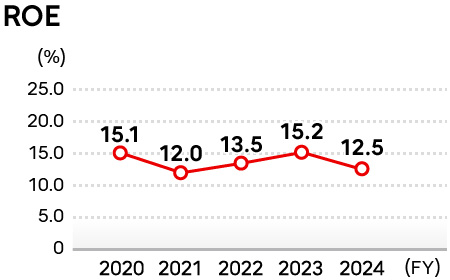
| ROE | 15.1% | 12.0% | 13.5% | 15.2% | 12.5% |