Trends in Share Price & Dividends
As of April 1st, 2024, Fujitsu conducted a stock split at a ratio of 10 shares per common share. Figures show amounts converted to the post-stock split basis.
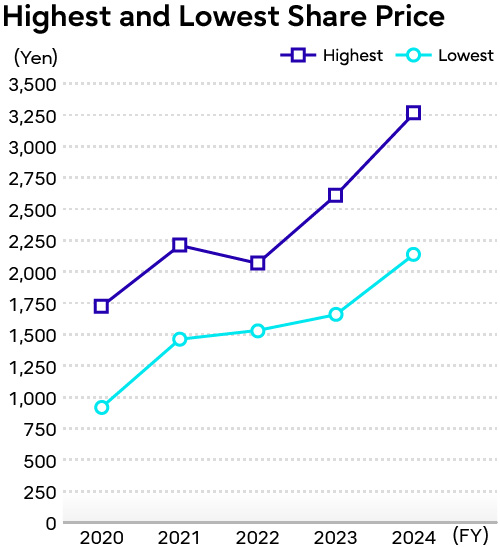
Highest and Lowest Share Price (Yen)
| Highest | 1,725.0 | 2,209.5 | 2,067.0 | 2,608.5 | 3,260.0 |
|---|
| Lowest | 919.5 | 1,461.5 | 1,532.0 | 1,657.0 | 2,136.5 |
|---|
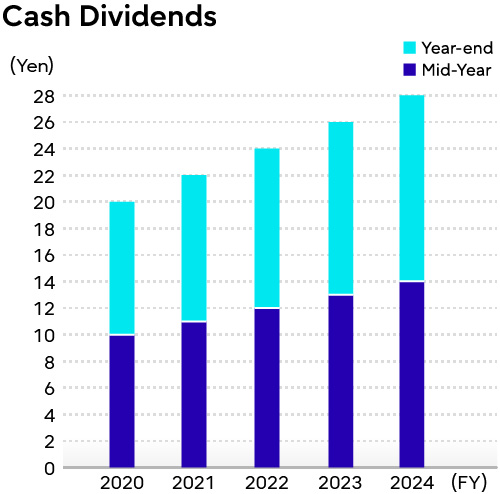
Cash Dividends (Yen)
| Full year | 20 | 22 | 24 | 26 | 28 |
|---|
| Mid-year | 10 | 11 | 12 | 13 | 14 |
|---|
| Year-end | 10 | 11 | 12 | 13 | 14 |
|---|
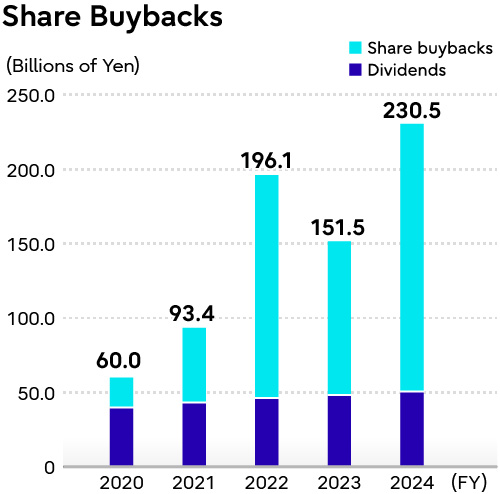
Share Buybacks (Yen)
| Total shareholder returns | 60.0 | 93.4 | 196.1 | 151.5 | 230.5 |
|---|
| Share buybacks | 20.1 | 50.1 | 150.0 | 103.1 | 180.0 |
|---|
| Dividends | 39.9 | 43.3 | 46.1 | 48.4 | 50.5 |
|---|