
Analysis of JAMIS Farmgate prices
Article by Jermaine Samuels
Introduction
Jamaica is known for its diverse agricultural products which are found in many of our exquisite cuisines, natural herbs, spices and remedies. These products are typically produced by farmers nationwide and are available on a seasonal basis. Based on historical data provided by the Statistical institute dated 2007, approximately 326,000 hectares of land are dedicated to active farmlands, 62% of these lands consists of both pastures and crops. The allocation of land solely dedicated to crops is approximately 154,000 hectares which actually represents a decline of about some 23,000 hectares based on a prior agricultural census executed in 1996.
Despite the reported decline in active farmlands associated with crops, agriculture remains a priority for the Jamaican government as it accounts for 8.68% share of gross domestic product in 2020, where approximately 18% of the nation’s active population is employed in agriculture and 46% of the total population lives in rural areas where agricultural products are cultivated and therefore agriculture plays a pivotal role in Jamaica’s cultural development.
As an important commodity within the economy it is imperative to review and analyze the cost, distribution, and quality of agricultural products. As crops are cultivated mainly on a seasonal or regional basis there is significant value that can be derived if the proper channels are capitalized, to maximize general public consumption and to ultimately improve revenue distribution facilitated by agriculture. Agricultural products are typically available nationwide from basic corner stalls, brick and mortar businesses, supermarket etc. and as such many businesses stand to benefit from affordable and quality produce from farmers across the nation given that they have access to the necessary information that will aid in strategizing methods and timeframes to purchase.
JAMIS
The Jamaica Agricultural Marketing Information System (JAMIS) provides weekly unbiased reports that relates to various agricultural products across Jamaica. The information includes prices, availability and quality which provides useful insights as to how, where and when to purchase various products. There are 4 price point reports on the JAMIS website:
2) Retail Prices
3) Wholesale Prices
4) Municipal Prices
The price point of interest that was analyzed was the Farmgate prices which as the website stipulates are agricultural prices collected on Wednesdays from farmers by the Marketing and Extension officers of the rural agricultural development authority (RADA). The prices are a representation of produce cost per Kilogram for the following Saturday of when the data was collected.
Data Collection
Jamis Farmgate API
The JAMIS website consisted of 4 report types where only the farmgate data was extracted and analyzed to assess farm prices of different agricultural products. FastAPI is an open source high performance web framework that facilitated converting Jamis website data into an analytics opportunity that can potentially create avenues for data monetization across the agricultural industry.
In order to extract data from the JAMIS website an API was built using the FastAPI software framework. The API allows downloading of individual pricing reports of produce between 2012 and 2021 as pdf files, after which the data is extracted as stored as a database file.
Data Description and Modeling
The information below outlines the data collected, data dictionary, and prediction model utilized.
Description
Website: https://www.ja-mis.com/companionsite/home.aspx
Price Point Dataset: Farmgate
Date when prices were collected: Between Year 2012 and 2021
Products: 36 different agricultural products.
Product Category: 5 types of products (Fruit, Root Crops, Vegetables, Herbs and Spices, Legumes).
Table representing product categories and individual products
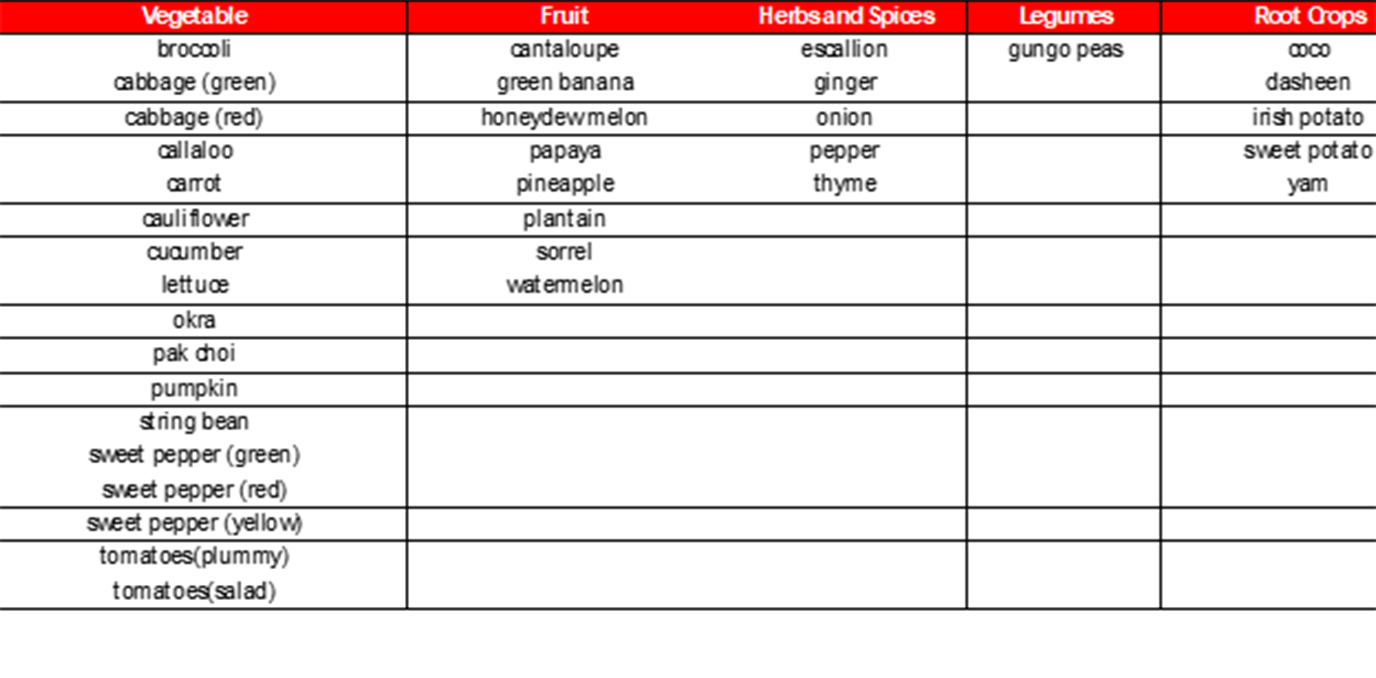
Data Dictionary
Price Date: The date the price was recorded
Parish: The parish in which the commodity (produce) is located
Commodity: The name of the agricultural product
Type: A description of the agricultural product
Category: The category that the agricultural product belongs to
Supply: An indication of the abundance of the product
Grade: An indication of the quality of the product
Price: An indication of the price of goods
Most frequent: An indication of the most frequent price of commodity (produce)
Data Modeling
To predict the price of different products over time the variable to consider and to build a prediction model against is the most frequent price variable. This attribute contains contiguous values and therefore a regression model is the most suitable approach to determine the relationship between all attribute columns from the dataset against the most frequent price column which is the target variable.
The modeling process was measured against 5 different regression models where the model with least mean square error or mean percentage error and the highest r2 score was selected. The r2 score is a measure of how well the proportion of variance of the product prices is explained by all the other columns / attributes within the dataset. The model selected was built from Random Forest Regressor which subsequently can be used to predict future product prices, and can be modified or rebuilt to incorporate data from other JAMIS agricultural product prices.
Random Regressor Performance:
Mean Absolute Percentage Error (MAPE) value given in percentage: 13.81%
Mean absolute error: 24.33
Mean squared error: 47.45
r2 score: 86.82 %
Model performance: 86.82% accuracy
* Note (Larger r2 scores implies greater dependency of product prices on the independent variables such as date, parish, commodity, supply, type, supply, grade, etc) *
Data Analysis
Data analysis accounts for years 2018-2020 to analyze availability, cost and distribution of different agricultural products. The data for year 2021 appeared to be inconsistent and anomalous to prior data collection observed within the dataset, this situation suggests that data collection practices were significantly impaired for this year, one suspected cause may be due to the pandemic COVID-19 where social distancing and government mandates may have prohibited the process. Additionally, all analysis performed does not account for any external data / events that is not mentioned within the data dictionary. Therefore only the information extracted from the data was represented.
Cost, Availability and Distribution
Of the five categories of agricultural products within the dataset fruits represents over 20% of the total amount of crops reported. To perform a preliminary analysis of cost, availability and distribution of products the fruits product category provides sufficient data to analyze the results.
Fruits Cost:
The Diagram below represents a size comparison of the total average costs of fruits by Parish.
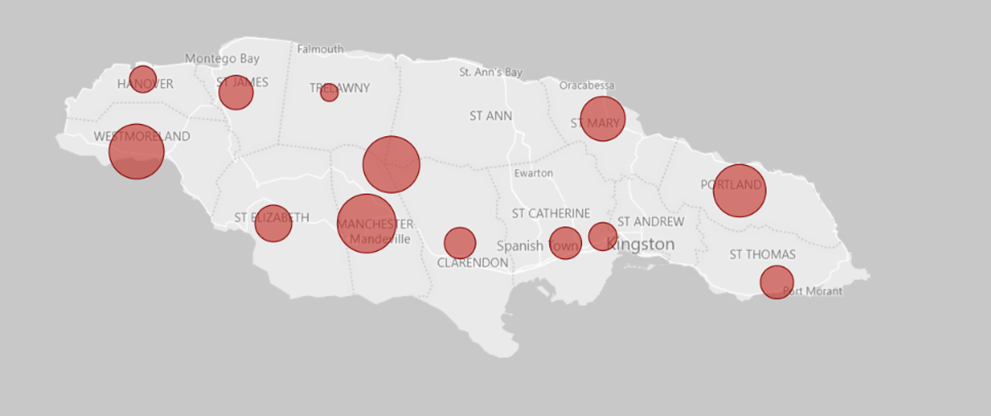
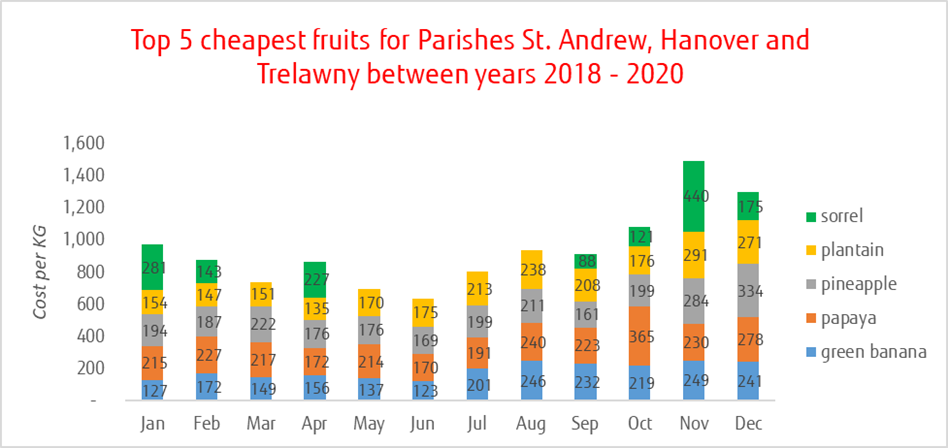
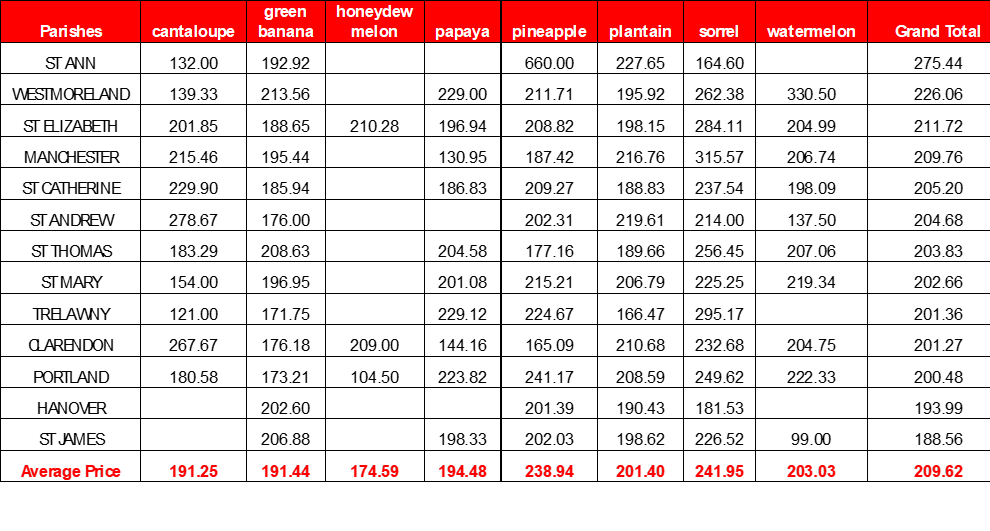
The cheapest produce are found within the parishes of St. Andrew, Hanover and Trelawny with an average price of $199 JMD, $198 JMD and $193 JMD per KG/ lb respectively. The top 5 least expensive products from these three parishes including their average prices are green banana ($185.83 JMD), plantain ($191.80 JMD), pineapple ($203.67 JMD), sorrel ($217.25 JMD) and papaya ($229.12 JMD). In any event Trelawny based on average price of products suggest that the parish would be any consumer or brick and mortar business best bet to purchase agricultural products at an affordable price.
The stack bar graph below indicates the cost of top 5 least expensive fruits based on the respective month.
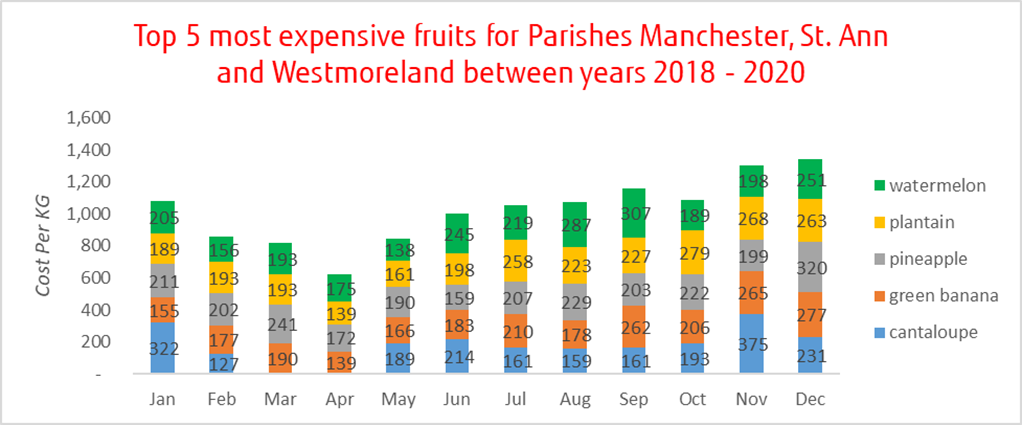
On the other hand the most expensive produce are found within the parishes of Manchester, St. Ann and Westmoreland with an average price of $217 JMD, $216 JMD and $215 JMD per KG/ lb respectively. The top 5 most expensive products these three parishes including their average prices are green banana ($201.44 JMD), cantaloupe ($208.68 JMD), pineapple ($211.41 JMD), watermelon ($214.24 JMD) and plantain ($216.29 JMD).
The stack bar graph below indicates the cost of top 5 most expensive fruits based on the respective month.
Fruits without pricing data for consecutive months were excluded as they are not consistent with data point collected for other crops.
Fruits price distribution:
The results for most and least expensive implies that some fruits are expensive and affordable in certain parishes at specific times of the year. One such fruit for example is green banana which is typically sold at a lower price for the first half of the year.
Table below displays average price for banana between years 2018 -2020.
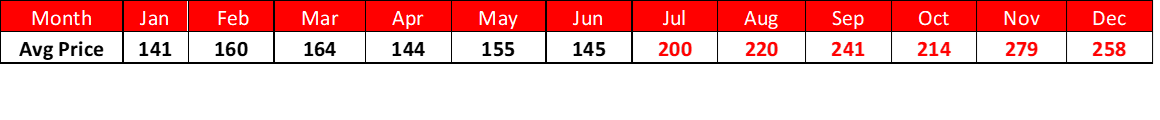
The total average price for green banana over all three years accumulates to $194 JMD per KG, based on these prices it is acceptable to take the position that green banana prices in excess of $194 JMD is expensive and the prices below that amount are more affordable. The month over month average data for green banana suggest that purchasing green banana between January and June would be most economical for brick and mortar businesses and consumers.
Conversely farmers could invest on relevant resources that fosters greater green banana cultivation practices in the earlier part of the year. The extra produce could then be used to mitigate cost associated with green banana cultivation later on in the year by selling the surplus at affordable prices and thus eliminating or minimizing competition.
Fruits Availability:
The data indicates that Fruits are not abundant, however are available in scarce to moderate quantities across the island. This is accounted for by analyzing the amount of price points recorded within the dataset. Less 1% of the total price points in the dataset was recorded as Abundant for fruits, where the total amount for moderate price points exceeded 55%. A similar trend was observed for green bananas and so the availability for this crop is considered to be moderately available. The analysis for different agricultural products categories and other fruits can be accomplished by repeating the analysis procedure done for green banana which would highlight price distribution and availability. The table below indicates fruit prices by parish where missing prices indicates that no price was recorded for that fruit in that parish.
The stack bar graph below indicates the cost of top 5 most expensive fruits based on the respective month.
 Note: All Parish agricultural product prices report excellent product quality as the primary standard
Predictions
So far we’ve done some business intelligence on how prices are distributed for different agricultural products that will aid in farmers strategizing for improved sales output, consumer being able to purchase affordable products and brick and mortar companies benefiting from increased profits by managing and choosing affordable supply. It’s now time to look at how prices may vary over time given the data we have at our disposal.
General trend for product categories.
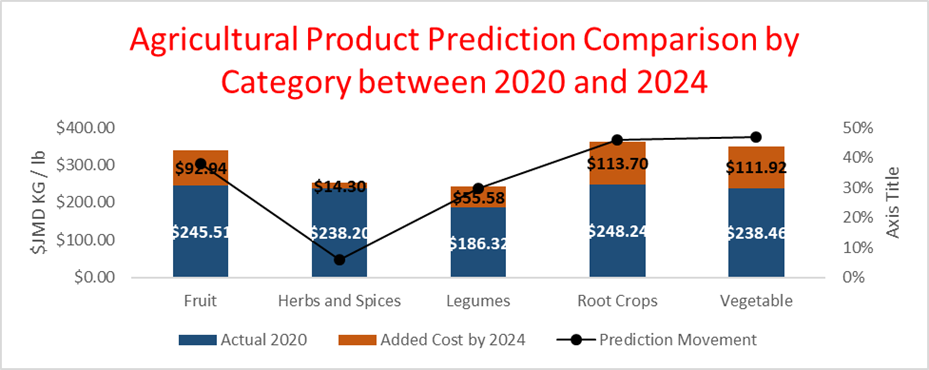
The prediction model indicates that there will be a general increase in product prices for all product groups and this rise will persist as a trend unless there are significant changes within the agricultural sector. The results show only product category Herbs and Spices will not experience a significant spike in produce value prices with only an estimated increase by 6% by 2024.
The other product categories is expected to have a minimum rise in price of approximately 30% to an upper limit of approximately 47%. These predictions may be due to higher price increases over the years for product categories such as fruits, legumes, root crops and vegetables as opposed to Herbs and Spices, where product prices has remained relatively stable. The general increase in prices implies that farmers may be experiencing higher overheads and the costs are translated to goods / produce in order to yield profit. Conversely brick and mortar business and by extensions consumers are subjected to higher cost for agricultural products.
Limitations
These price increases will vary by individual crops, however the prediction trend observed is solely based on historical data that resides within the JAMIS farmgate dataset. The prediction provides reasonable estimates for coming years but does not account for all contributing factors that affect crop cultivation throughout the nation. Farmers are faced with various challenges in relation to cost of production.
These issues vary across a broad spectrum and affects crop yield in significant ways that drives up pricing such as pest control, inclement weather conditions, Refrigeration and technological equipment procurement etc. Despite these notable challenges, the prediction model does indicate a realistic movement of product prices over time which generates further urgency as to why farmers should capitalize on strategic cultivation and why brick and mortar companies should seek out affordable and readily available produce all of which can be provided with data analytics.
Analyzing and reporting the JAMIS Farmgate data is an effective means for farmers and brick and mortar companies to leverage business intelligence as it relates to produce affordability and availability.
Future Work:
The results of the analysis and prediction may be improved by expanding the API tool to include additional data points from the JAMIS website such as Wholesale, Retail and Municipal. The accuracy can also be enhanced by adding external data such as economical and climate changes to account for external influences. Finally by automating the data extraction and report generation this may create a versatile tool that accurately analyzes product prices for various entities throughout Jamaica.