

Environmental data
Business Activities & Environmental Burden
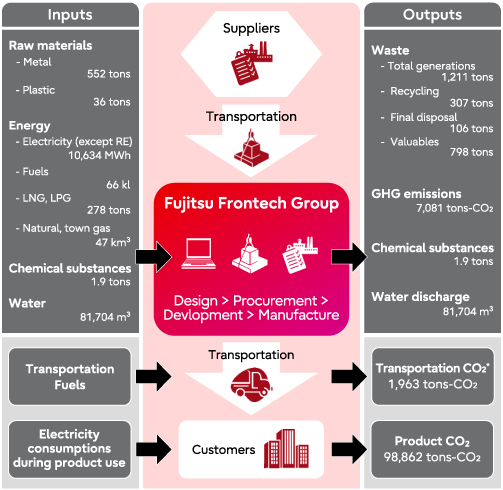
Material Balance (FY2023)
We promote our eco-friendly business as well as capture our environmental performance in the whole value chain.
[Scope]
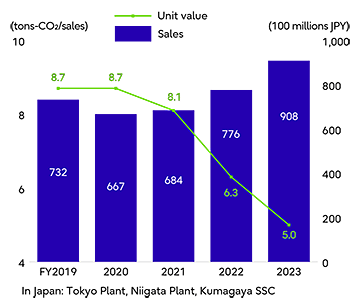
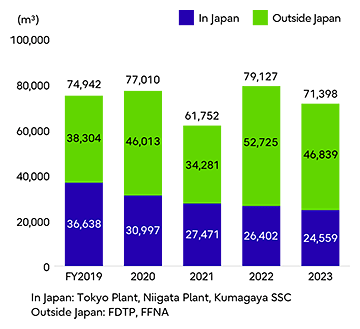
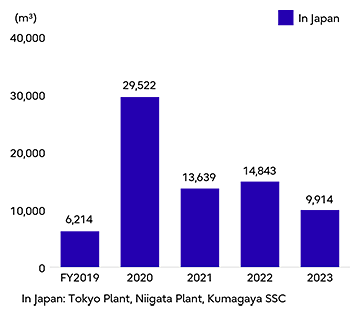
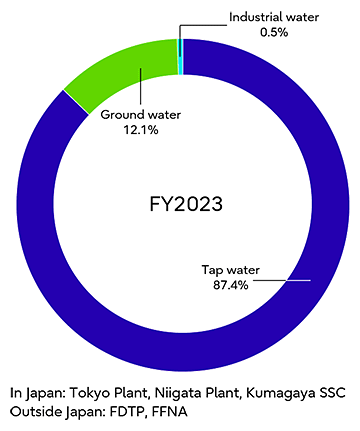
In Japan: Tokyo Plant, Niigata Plant, Kumagaya SSC Outside Japan: FDTP, FFNA
* "Transportation CO2" (Outputs) is the sum of Niigata Plant and FFNA.
Environmental Performance
We measure and monitor the impacts on the environment. We promote environmental compliance based on these information.
Trend Graphs
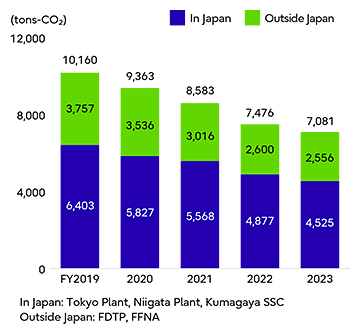
Climate Change
(1) Total GHG emissions
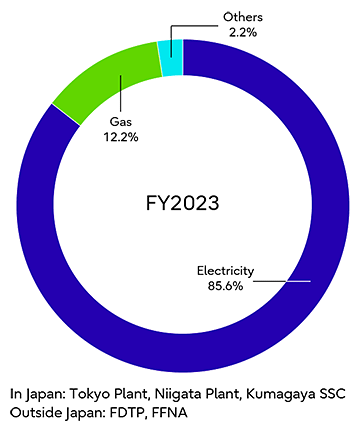
(2) Ratio of energy use (except RE)
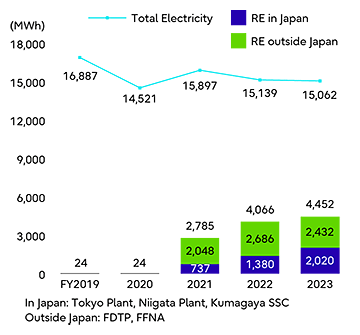
(3) Renewable energy use
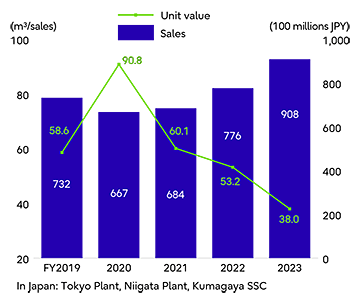
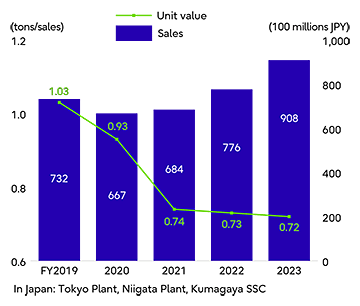
(4) Unit value of GHG emissions / sales (in Japan)
[Explanation]
Applied to sites which are included in SBTi (Science Based Targets initiative) etc. that Fujitsu Group discloses to. And, conversion factor from purchased electricity consumptions to CO2 is all "0.57 tons-CO2/MWh" except RE. Explanation about each graph is, as follows:
(1)Total GHG emissions: They have been decreasing year by year thanks to the adoption of RE etc.
(2)Ratio of energy use (FY2023): "Others" are some kinds of fuel such as gasoline.
(3)From FY2021, we started introducing RE in Japan and FDTP.
(4)Unit value of GHG emissions / sales (in Japan): Divided GHG emissions by non-consolidated sales.
*Data on value-chain emissions (Scope 1 – 3) is disclosed here.
Water Resources
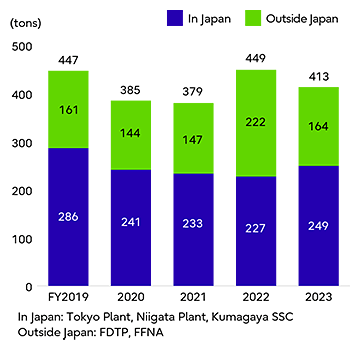
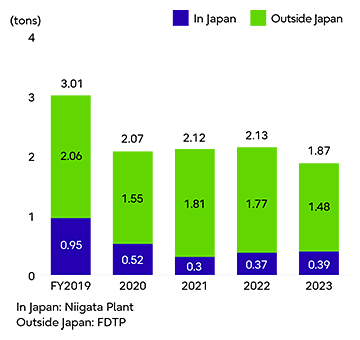
(1) Tap water
(2) Ground water (in Japan)
(3) Ratio of used water
(4) Unit value of used water / sales (in Japan)
[Explanation]
Applied to sites which are included in CDP, DJSI (Dow Jones Sustainability World Index) etc. that Fujitsu Group discloses to. Explanation about each graph is, as follows:
(1)Tap water: In FY2023, it decreased by 2,000m3 or so compared to FY2022 in Kumagaya SSC, because of, for instance, switching some of toilet systems to a water saving type.
(2)Ground water: Increase in FY2020 was due to the use to melt much snow in Niigata Plant.
(3)Ratio of used water (FY2023): "Industrial water" is used only in FDTP (Philippines).
(4)Unit value of used water / sales (in Japan): Divided the total volume of tap and ground water by non-consolidated sales.
Resource Circulation
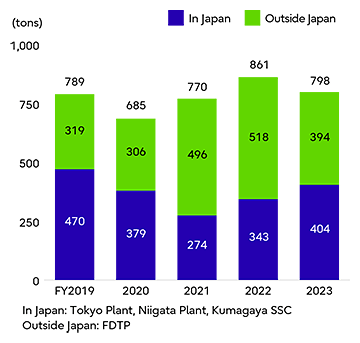
(1) Waste generations
(2) Sold valuables
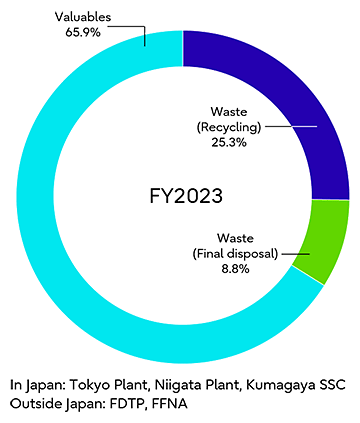
(3) Ratio of waste & valuables
(4) Unit value of waste & valuables / sales (in Japan)
[Explanation]
Applied to sites which are included in CDP, DJSI etc. that Fujitsu Group discloses to. Explanation about each graph is, as follows:
(1)Waste generations: They had a little increase in FY2023 in Japan because of replacement of office furniture.
(2)Sold valuables: Sold mainly metal scrap and used paper.
(3)Ratio of waste & valuables (FY2023): "Final disposal" means landfill of the unrecyclable sludge etc.
(4)Unit value of waste & valuables / sales (in Japan): Divided the total volume of waste and valuables by non-consolidated sales.
Chemical Substances
(1) Treated chemicals
(2) Ratio of treated chemicals
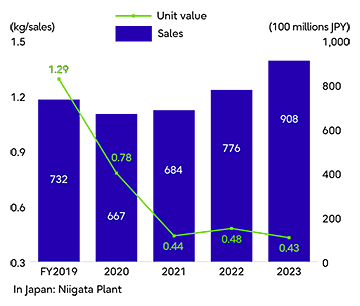
(3) Unit value of treated chemicals / sales (in Japan)
[Explanation]
Applied to sites which are included in CDP, DJSI etc. that Fujitsu Group discloses to. Counted chemicals are ones whose treated volume is over 100kg per year. Explanation about each graph is, as follows:
(1)Treated chemicals: We mainly use solvent as chemical substances in the processes of manufacturing.
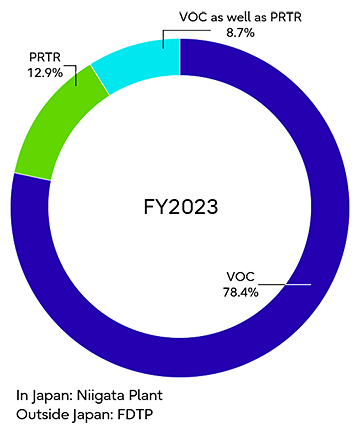
(2)Ratio of treated chemicals (FY2023): "VOC as well as PRTR" is a chemical subject to both VOC and PRTR.
(3)Unit value of treated chemicals / sales (in Japan): Divided the volume of treated chemicals by non-consolidated sales.
Pollution Prevention - FY2024 -
We monitor the status of ground water and discharged water individually on a regular basis, to prevent environmental pollution.
(1) Measurement of "Ground water"
Unit: mg/L
| Measured Items | Legal Standards | Headquarters / Tokyo Plant | Niigata Plant | Kumagaya SSC |
|---|---|---|---|---|
| Results | Results | Results | ||
| Lead and its compounds | 0.01 | Below Sta. | Below Sta. | Below Sta. |
| Hexavalent Chromium | 0.05 | Below Sta. | Below Sta. | - |
| Total Mercury | 0.0005 | Below Sta. | - | - |
| Total Cyanide | Not to be detected | - | Below Sta. | - |
| Trichloroethylene | 0.01 | Below Sta. | Below Sta. | Below Sta. |
| Tetrachloroethylene | 0.01 | - | - | Below Sta. |
| Dichloromethane | 0.02 | Below Sta. | - | - |
| 1,2-Dichloroethane | 0.004 | Below Sta. | - | - |
| 1,1-Dichloroethene | 0.1 | Below Sta. | Below Sta. | Below Sta. |
| 1,2-Dichloroethene | 0.04 | Below Sta. | Below Sta. | Below Sta. |
| Cis-1,2-Dichloroethylene | 0.04 | Below Sta. | Below Sta. | Below Sta. |
| Trans-1,2-Dichloroethylene | 0.04 | Below Sta. | Below Sta. | Below Sta. |
| 1,1,1-Trichloroethane | 1 | Below Sta. | Below Sta. | Below Sta. |
| 1,1,2-Trichloroethane | 0.006 | Below Sta. | - | - |
| Carbon Tetrachloride | 0.002 | - | - | Below Sta. |
| Selenium | 0.01 | Below Sta. | - | - |
| Cadmium | 0.003 | Below Sta. | Below Sta. | - |
| Alkyl Mercury | Not to be detected | Below Sta. | - | - |
| Organic Phosphorus | Not to be detected | Below Sta. | - | - |
| Boron | 1 | Below Sta. | Below Sta. | - |
| Fluorine | 0.8 | Below Sta. | Below Sta. | - |
| Nitrate-nitrogen and Nitrite-nitrogen | 10 | Below Sta. | - | - |
| Arsenic | 0.01 | Below Sta. | Below Sta. – 0.027 (Note 4) | Below Sta. |
- Note 1: Measuring pointsWe measured at 4 points in Headquarters / Tokyo Plant and Kumagaya Service Solution Center, while measuring at 7 points in Niigata Plant.
- Note 2: Measuring cycleWe measured once per year in Headquarters / Tokyo Plant and Kumagaya Service Solution Center, while measuring twice per year in Niigata Plant.
- Note 3: ResultsWe indicated "Below Sta." where the values had been below legal standards, while indicating the maximum value as well where the value(s) had exceeded them.
- Note 4: Exceeding of standardAs for Arsenic which had exceeded legal standard in Niigata Plant, we regarded as natural origin because we have never used it before.
- Note 5:"-" means it is not applicable to measurement.
(2) Measurement of "Discharged water"
Unit: Per 1 liter
| Measured Items
* () is the unit of each measurement. | Legal Standards | Niigata Plant | Kumagaya SSC |
|---|---|---|---|
| Results | Results | ||
| Hydrogen Ion Exponent (pH) | 5.8 – 8.6 | 7.0 – 7.6 | 6.7 – 7.6 |
| Biochemical Oxygen Demand - BOD (mg) | 160 | - | Below Sta. |
| Suspended Solids - SS (mg) | 200 | Below Sta. | Below Sta. |
| Amount of Zinc (mg) | 2 | Below Sta. | - |
| Lead and its compounds (mg) | 0.1 | Below Sta. | - |
| Amount of Phosphorus (mg) | 16 | - | Below Sta. |
| Arsenic and its compounds (mg) | 0.1 | Below Sta. | - |
- Note 1: Measuring pointsNiigata Plant - Both measuring points and measuring areas are identified each other, depending on the kinds of chemicals. (Measuring points: 2 – 8 points)
Kumagaya SSC - Only 1 point which is a final drainage outlet. - Note 2: Measuring cycleNiigata Plant - We measured only Arsenic and its compounds once per year, while measuring others twice per year.
Kumagaya SSC - four times per year. - Note 3: ResultsAs for pH, we indicated its minimum and maximum values. As for others, we indicated "Below Sta." where the values had been below legal standards, while indicating the maximum value as well where the value(s) had exceeded them.
- Note 4:"-" means it is not applicable to measurement.
Environmental Report
Environmental Report introduces mainly our environmental business, including "Environmental Action Plan".