Archived content
NOTE: this is an archived page and the content is likely to be out of date.
DTrace Technical Outline of Solaris™ 10 Operating System function
DTrace : [ Technical Outline ]
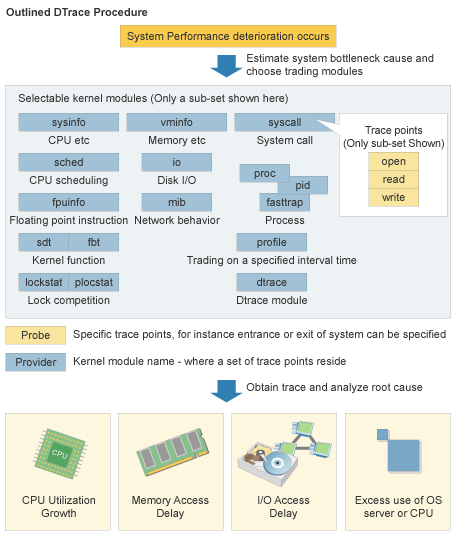
DTrace, creates an environment in which approximately 40 thousand trace points are automatically populated around the Solaris 10 system.
The DTrace environment spans the Solaris 10 system. Each trace point provides focus and fine grained information on system performance, process deterioration and other system problems.
Trace actions are controlled by D Script. This lets you select target kernel modules, call name information and the output format. It also lets you focus on specific information, for example invalid data, delayed processing time or repeated system calls.

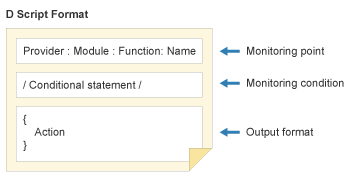
D Script format
D Script has its own simple command definition language (D Language). System administrators will find D language easy to use as it has similar syntax to the programming language C. Just a few simple rules need to be learnt.
Monitoring point, monitoring condition and output format are the three elements of the D language.

Monitoring point
The top line of D Script, (the monitoring point definition) specifies the trace points and necessary information. It consists of just four comma separated fields: Provider, Module, Function, Probe.
- Provider: Is the target kernel module set or library to which the trace points belong.
- Module: Is the target module name (This parameter can be omitted)
- Function: Is the name of the program functions such as system call name (This parameter can be omitted)
- Probe: Specifies the condition or point were tracing information will be obtained. (Typically this represents a location in a function)
For further details, please refer to the Solaris Dynamic Tracing Guide from Sun Microsystems.

Monitoring condition
This statement specifies the condition for obtaining traced information. Statement is bounded by forward slashes ("/").

Output format
This statement specifies a output format of traced information. The statement is between parentheses ("{" and "}").

D Script can be also specified in command format.

DTrace example
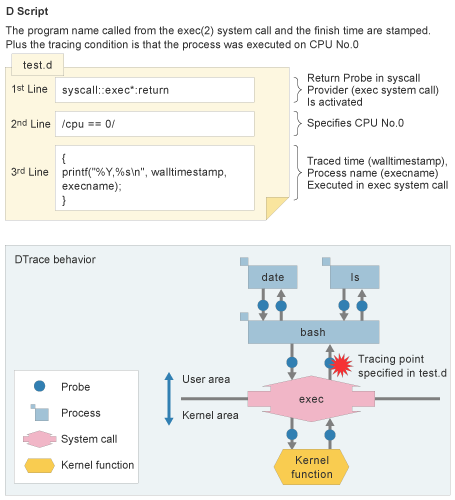
Let's look at an example that analyses system performance. The following example shows that a process executing on CPU No.0 issues a system call, exec(2).
Let's prepare the D Script.
On the first line, you specify the monitoring point. To check status just after issuing an exec system call, you specify Provider field as Syscall, Function field as exec, and Probe field as return.
On the second line, you specify the conditional statement.
you specify CPU No. as 0.
On the third line, you specify the output format. You specify timestamp (walltimestamp) and the process name that exec(2) system call was executing.


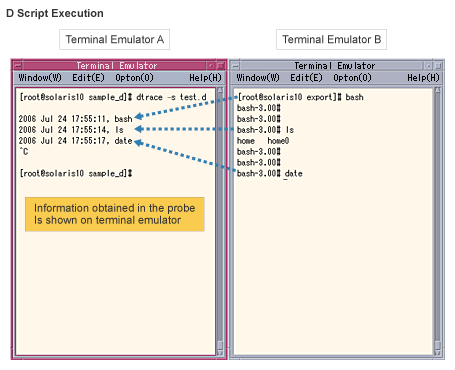
Following D language definition, you only have to execute dtrace(1M) command.
Executing a Unix command such as date(1) or ls(1) on another screen, will let you confirm those commands were executed. (As above)
For further details, please refer to the Solaris Dynamic Tracing Guide from Sun Microsystems.
External Evaluation
Predictive Self-Healing wins InfoWorld 200 Innovator Award
Innovation Awards: The winners are... (The Wall Street Journal Online)


