Archived content
NOTE: this is an archived page and the content is likely to be out of date.
Water
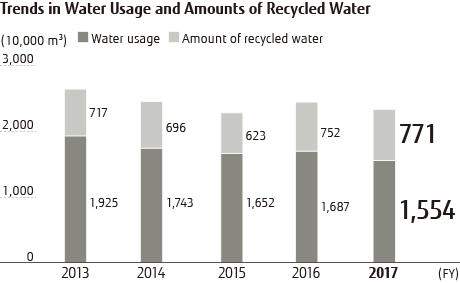
Trends in Water Usage and Amount of Recycled Water
| Indicator | FY2013 | FY2014 | FY2015 | FY2016 | FY2017 |
|---|---|---|---|---|---|
| Water usage
[10,000 m3] |
1,925 | 1,743 | 1,652 | 1,687 | 1,544 |
| Amount of recycled water
[10,000 m3] |
717 | 696 | 623 | 752 | 771 |
| Water discharge
[10,000 m3] |
1,525 | 1,548 | 1,408 | 1,528 | 1,461 |
| BOD [tons] | 373 | 349 | 397 | 391 | 290 |
| COD [tons] | 234 | 192 | 160 | 179 | 94 |

Total water withdrawal data by source
| Source | FY2015 | FY2016 | FY2017 |
|---|---|---|---|
| Fresh surface water, including rainwater, water from wetlands, rivers, and lakes (megaliters) | 407 | 419 | 0 |
| Brackish surface water/seawater (megaliters) | 0 | 0 | 0 |
| Groundwater – renewable (megaliters) | 6,050 | 6,415 | 5,782 |
| Groundwater - non-renewable (megaliters) | 0 | 0 | 0 |
| Produced water (megaliters) | 0 | 0 | 0 |
| Third party sources (megaliters) | 10,065 | 10,035 | 9,761 |
| Total withdrawals (megaliters) | 16,522 | 16,869 | 15,543 |
Total water discharge data by destination
| Destination | FY2015 | FY2016 | FY2017 |
|---|---|---|---|
| Fresh surface water (megaliters) | 12,791 | 13,514 | 12,837 |
| Brackish surface water/seawater (megaliters) | 0 | 0 | 0 |
| Groundwater (megaliters) | 0 | 0 | 0 |
| Third-party destinations (megaliters) | 1,289 | 1,766 | 1,770 |
| Total discharges (megaliters) | 14,080 | 15,280 | 14,607 |
- Reducing the Amount of Water Used