Archived content
NOTE: this is an archived page and the content is likely to be out of date.
Waste
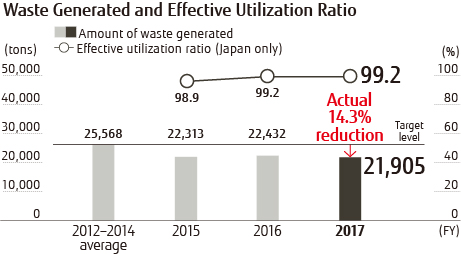
Trends in Amount of Waste Generated and Effective Utilization Ratio
| Indicator | FY2012 | FY2013 | FY2014 | FY2015 | FY2016 | FY2017 |
|---|---|---|---|---|---|---|
| Amount of waste generated [tons] | 28,005 | 25,085 | 23,614 | 22,313 | 22,432 | 21,905 |
| Effective utilization ratio [%] | 96.4 | 97.9 | 98.9 | 98.9 | 99.2 | 99.2 |

Breakdown of Waste Generated, Effective Utilization, and Final Disposal
| Waste Type | FY2017 | ||
|---|---|---|---|
| Waste Generated [tons] | Effective Utilization [tons] | Final Disposal [tons] | |
| Total | 21,905 | 20,796 | 1,108 |
| Sludge | 4,158 | 4,007 | 150 |
| Waste oil | 1,121 | 1,104 | 18 |
| Waste acid | 4,072 | 4,072 | 0 |
| Waste alkali | 3,803 | 3,429 | 401 |
| Waste plastic | 3,314 | 3,267 | 46 |
| Waste wood | 898 | 894 | 4 |
| Waste metal | 791 | 791 | 0 |
| Glass / eramic waste | 491 | 486 | 5 |
| Other (*1) | 3,230 | 2,746 | 484 |
*1 Other:
Other includes general waste, paper waste, septic tank sludge, residue, rubble, textile waste, animal and plant residue, and infectious waste.
- Limiting Amounts of Waste Generated